


0
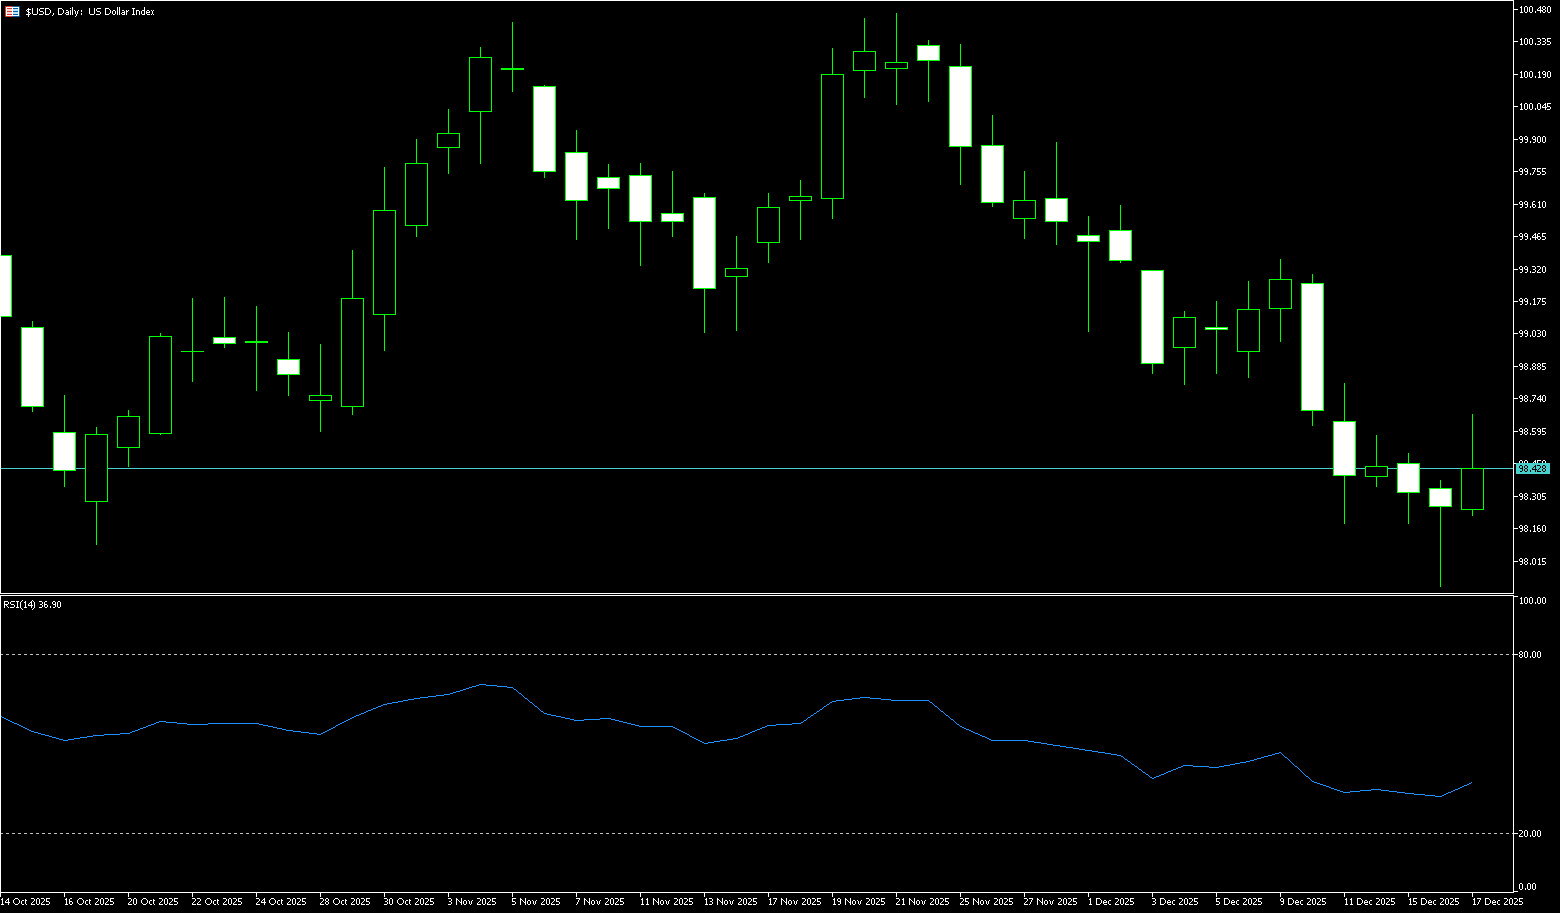
The US Dollar Index
The dollar fell against major currencies as the latest data showed stronger-than-expected US non-farm payrolls growth in November, but the unemployment rate rose to 4.6%, which the market believes may make the Federal Reserve cautious about further interest rate cuts in the short term. Specifically, the data showed that the US added 64,000 non-farm jobs in November, better than market expectations. However, the unemployment rate rose from 4.4% to 4.6%, and the new jobs were mainly concentrated in non-cyclical industries such as healthcare, suggesting that cyclical economic momentum remains limited. The dollar index fell for the second consecutive trading day. Among other major currencies, the euro rose slightly against the dollar, reaching its highest level since September. The pound performed strongly, rising against the dollar to a two-month high, with the market anticipating a possible interest rate cut by the Bank of England this week. Overall, weak US labor demand will support the pricing of a 50 basis point rate cut by the Federal Reserve funds futures next year, weakening the dollar.
The weakness of the dollar does not necessarily stem from an economic collapse; sometimes it is simply the disappearance of "certainty." The core logic supporting the dollar's strength in the past was "higher US interest rates and better growth." The current dollar trend is like a fierce tug-of-war. On one hand, interest rate cuts have reduced the attractiveness of yields; on the other hand, the relative resilience of the US economy may support safe-haven demand. The problem is that neither side has truly gained the upper hand yet. As a result, even short-term rebounds are quickly seen as selling opportunities by the market, creating a "sell on rallies" trading pattern. On the upside, watch for resistance at 98.79 (the 38.2% Fibonacci retracement of the rally from 96.22 to 100.39) and the 98.83 area (the 14-day moving average). On the downside, watch for support at 98.00 (the psychological level) and 97.46 (the low of October 1st).
Today, consider shorting the US Dollar Index around 98.48; Stop loss: 98.60; Target: 98.05; 98.00
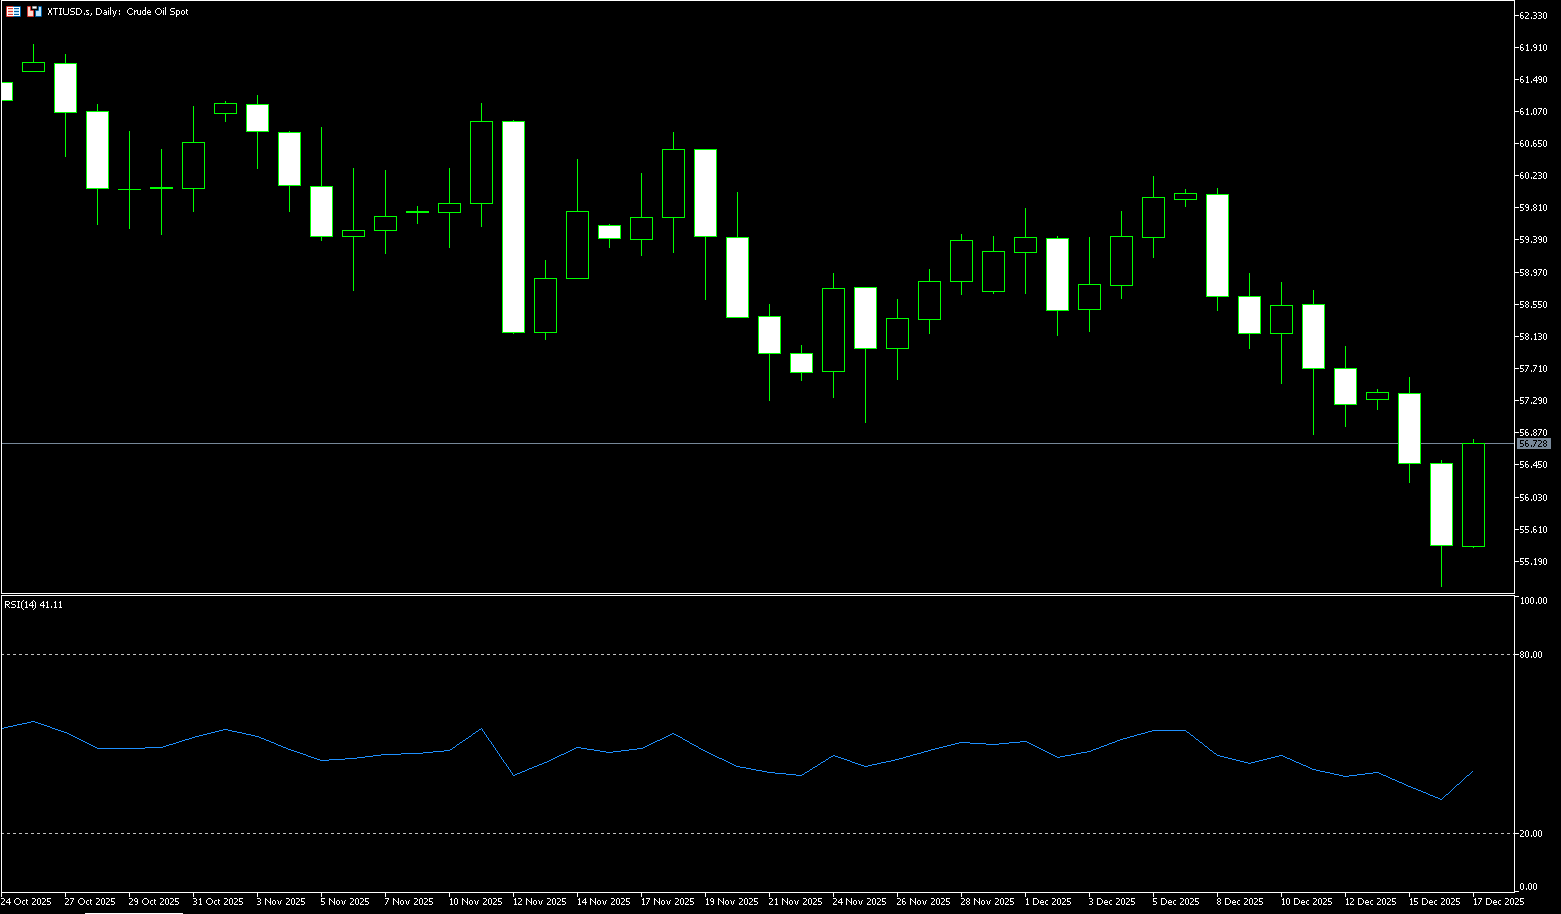
WTI Crude Oil
WTI crude oil continued its nearly two-week downward trend, breaking below the $60 mark and hitting a new low of $54.97. The price drop to near an 11-month low indicates that this selling pressure is not a localized sentiment, but rather a synchronized downward correction in the pricing of the entire crude oil complex. The core driver of this decline is the market's repricing of rising expectations for peace between Russia and Ukraine, and the resulting association with the easing of sanctions. The logic is clear: once restrictive measures are marginally relaxed, Russian crude oil that was previously stuck at sea or required a higher discount to be traded will theoretically find buyers more easily; at the same time, the reduced risk of disruption to energy infrastructure will also compress the geopolitical premium previously paid by the market. This decline is more like a "rapid clearing of risk premiums and expectation premiums" rather than a structural deterioration in the supply and demand balance overnight. For traders, a common side effect of such a decline is an increased bias towards discounts in the term structure, greater volatility in inter-month spreads, and price discovery becoming more sentiment-driven than inventory-specific.
Looking at the daily chart, after falling from the previous high of $60.09 (December 8th), the price initially fluctuated between $58 and $59 before breaking below the previous low of $56.24. The bears then pushed the price below $55 to a near 11-month low of $54.88. Recent bearish candles show a downward trend with lower highs and lower lows, indicating significant trendline resistance. However, this appears more like a technical pause than a trend reversal. Momentum indicators show that the MACD still dominates the downward momentum; the RSI is 41.14, close to oversold but not yet extreme, typically indicating a short-term technical rebound window, but this rebound is more likely to be met with resistance at resistance levels. Structurally, pay attention to $57.62 (9-day moving average). A recovery and hold above this level could potentially push the price back above the psychological level of $60.00. On the downside, key levels to watch are $54.78 (April low) and the area around $54.00. A decisive break below these support levels could lead to further downward movement on the daily chart.
Today, consider going long on crude oil around $56.40; Stop loss: $56.23; Target: $57.70; $57.90
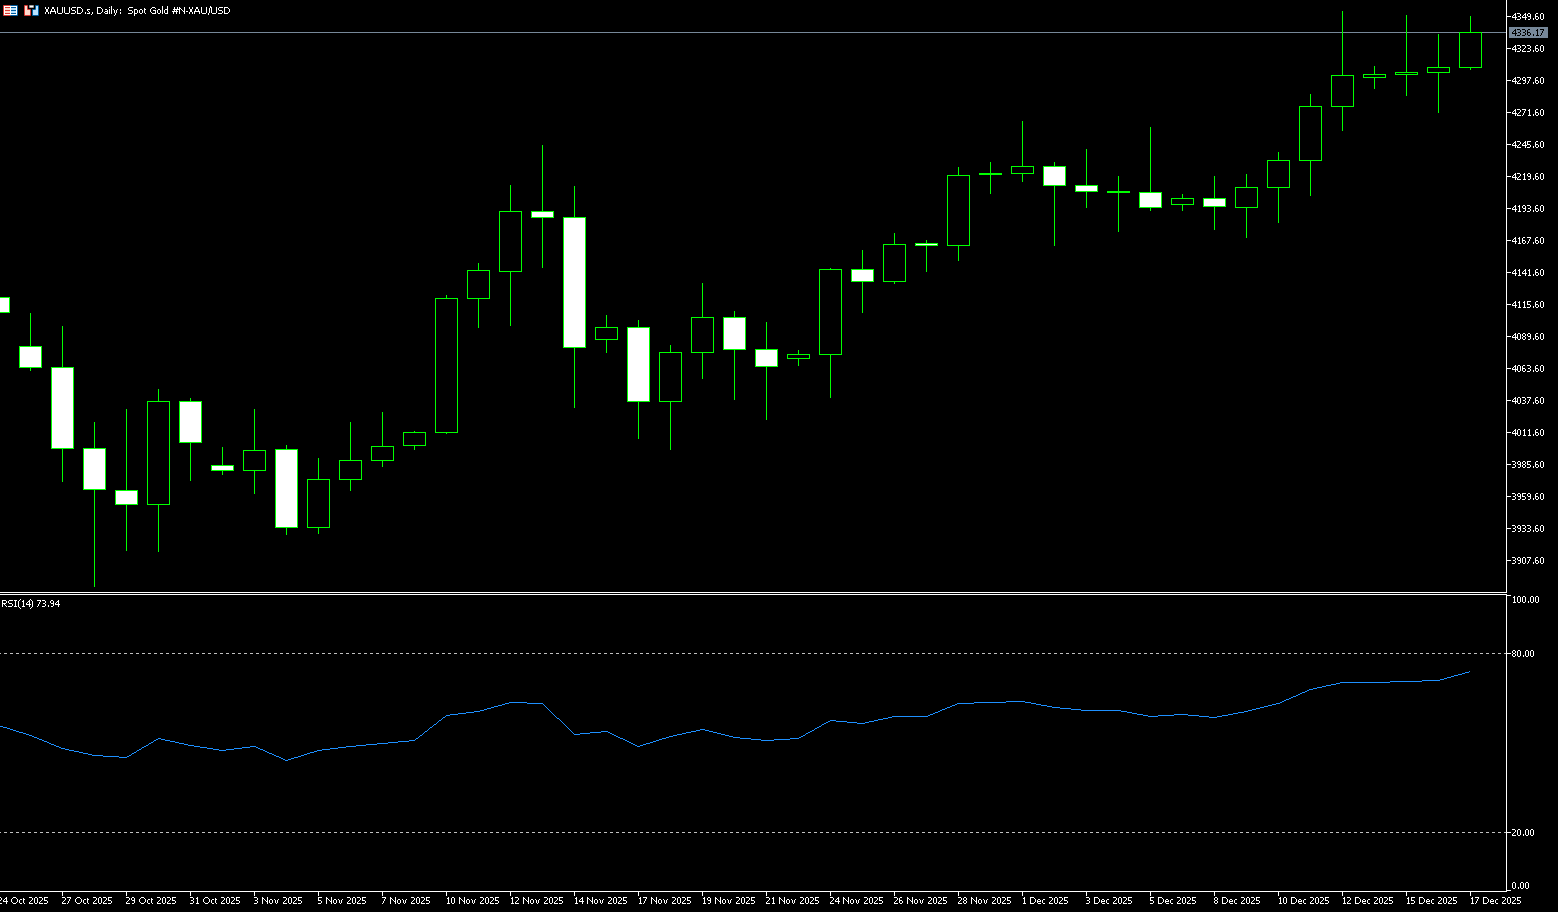
Spot Gold
On Wednesday, spot gold traded around $4,340 per ounce. Despite conflicting US non-farm payroll data, the rise in the US November unemployment rate strengthened expectations of future Fed rate cuts, supporting gold prices. Tuesday saw limited volatility. The dollar index fell to a two-month low, while the US 10-year Treasury yield declined slightly, both providing support for gold prices. While the recent weakening of the US dollar index is beneficial to gold bulls, and the market has interpreted the US non-farm payroll and retail sales data as positive, gold also faces several negative factors that collectively influence its price movement. One of the core logics behind the recent gold price increase is the weakening dollar. Gold is priced in the dollar, and as a substitute for the dollar, the most important international reserve currency, a decline in the dollar directly benefits gold. Although the Federal Reserve has linked interest rate cuts with its Reserve Management Purchase Program (RMP), hoping to lower short-term Treasury yields, the 30-year Treasury yield continues to hit new highs, which is unfavorable for non-interest-bearing safe-haven funds.
Spot gold maintains its upward trend, with the 5, 10, 20, and 30-day short-term moving averages all showing a bullish alignment and upward divergence. However, multiple pullbacks after reaching highs indicate significant divergence. After the release of the non-farm payroll data, gold needs more data for further guidance. The positive outlook for gold remains intact, with prices finding good support above the key 9-day simple moving average of $4,260. Furthermore, the 14-day Relative Strength Index (RSI) is above 70, indicating recent bullish momentum, but caution is warranted regarding the MACD divergence. If gold continues to trade above the psychological level of $4,300, it could prepare to retest the December 15 high of $4,350. Further buying above this level could even open the door to a retest of the all-time high of $4,381. On the other hand, if gold's rise is repeatedly capped at $4,350, it could set the tone for a bearish trend, with the first support level to watch being the December 16 low of $4,271. The next battleground level is at the 9-day simple moving average of $4,260.
Consider going long on spot gold today near $4,335; Stop loss: $4,330; Target: $4,365; $4,370
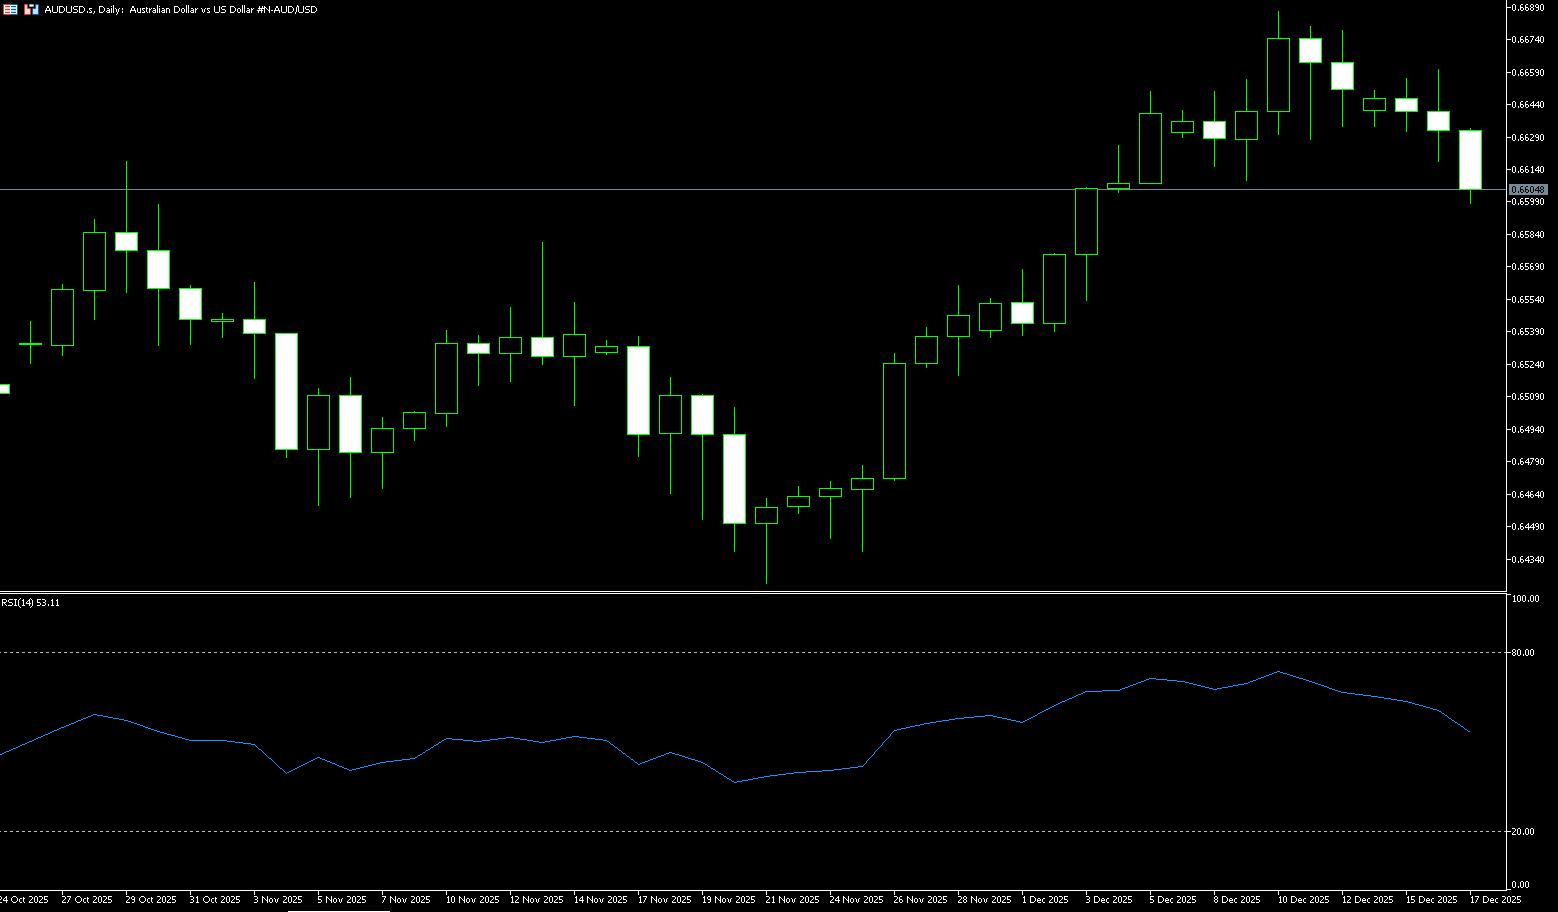
AUD/USD
The AUD/USD pair fell further to near 0.6600 as the US dollar outperformed other currencies. The Federal Reserve and the Reserve Bank of Australia are unlikely to cut interest rates in the near term. Investors are awaiting US CPI data for new clues about the outlook for US interest rates. The Australian dollar rebounded from 0.5914 to 0.6685 against the US dollar this year, primarily due not to Australia's strength, but to the weakness of the US dollar itself: weakening US employment, the Fed's resumption of rate cuts, and the government shutdown eroded the dollar's credibility; while Australia's stable economy and rising inflation led to tighter policy expectations, and the interest rate differential and confidence advantage drove the Australian dollar higher. If the US dollar continues to be under pressure in 2026, the Australian dollar may continue its upward trend. 2025 will be a volatile year for the Australian dollar against the US dollar. At the beginning of the year, the exchange rate hovered around 0.6140. As the situation reversed, the Australian dollar began a strong recovery, reaching a high of 0.6707 on September 17. Currently, the exchange rate is stable at around 0.6650, with a cumulative increase of about 7% for the year.
Midweek, the Australian dollar/US dollar pair traded around 0.6600. Technical analysis on the daily chart shows the pair trading within an ascending channel, reflecting a bullish bias. However, the pair is hovering around the 10-day simple moving average at 0.6639, indicating neutral short-term price momentum. The pair may test the psychological level around 0.6600. A break below this level could exert downward pressure, potentially moving towards the 6-month low near 0.6551 (the 89-day simple moving average). On the upside, the AUD/USD pair may target the three-month high of 0.6685, followed by the highest level since October 2024 at 0.6707. Further gains would support a test of the upper trendline of the ascending channel near 0.6740.
Consider going long on the Australian dollar around 0.6590 today; Stop loss: 0.6580; Target: 0.6640; 0.6645
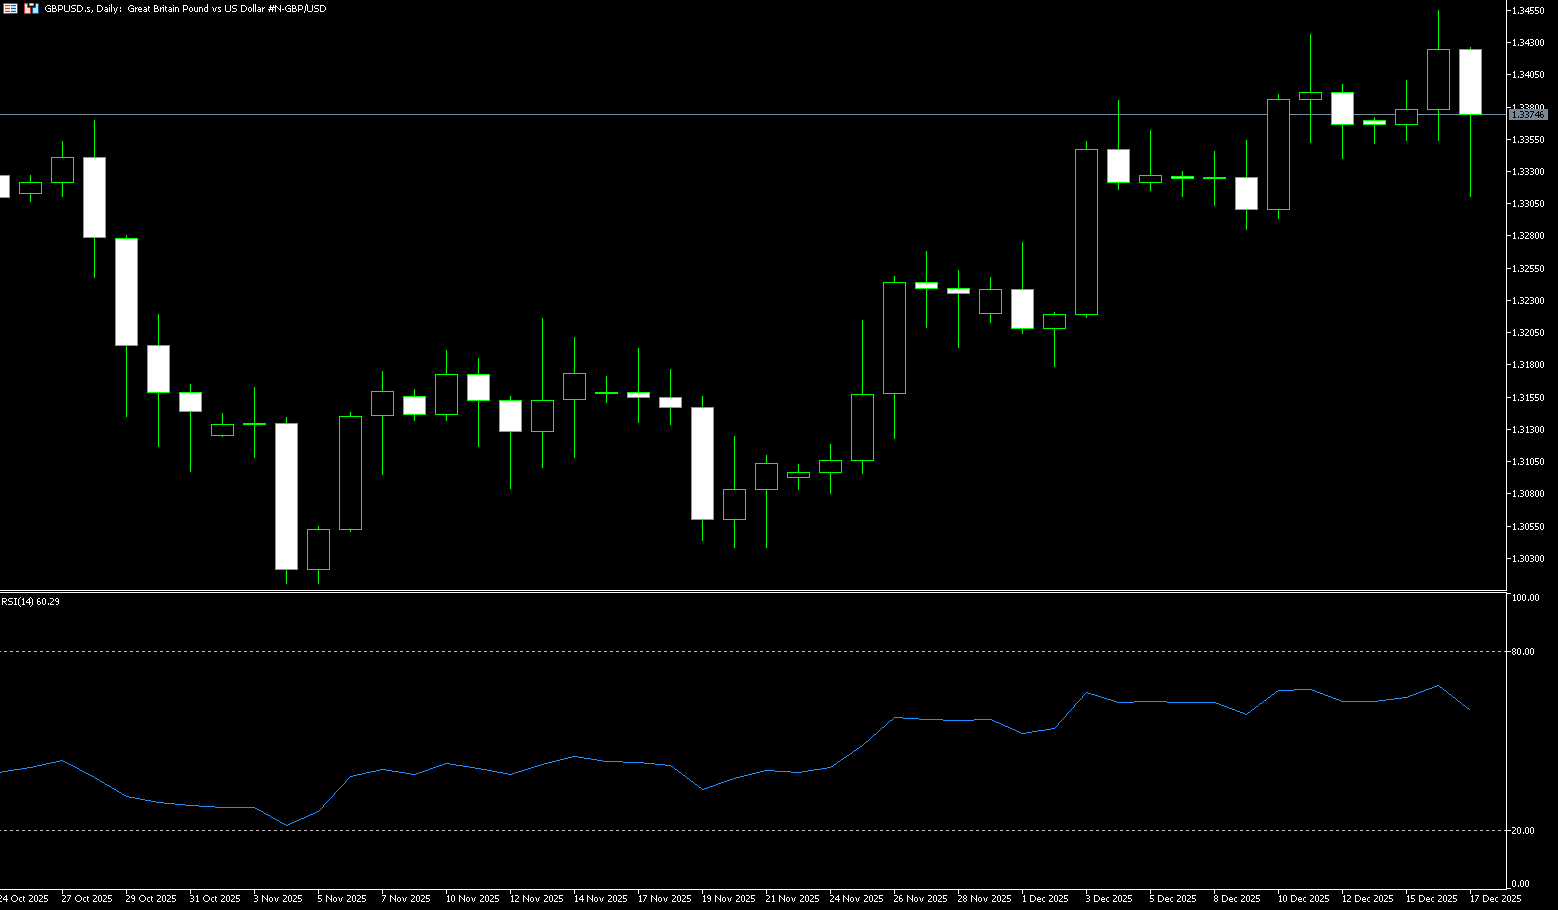
GBP/USD
GBP/USD experienced a rapid rise and fall mid-week, breaking through the previous trading range, indicating strong short-term bullish momentum. The combined impact of the US non-farm payroll report and the Bank of England's interest rate decision has brought the GBP/USD exchange rate forecast into focus as we approach the end of 2025. Multiple signs of weakness in the UK economy have led to strong market expectations of a Bank of England rate cut this week. This week's economic data calendar is very dense. The previously released November non-farm payroll data put pressure on the US dollar, pushing GBP/USD above 1.34. However, subsequent economic data this week will have a more significant impact on the pair's movement. The US non-farm payroll report was mixed. However, weaker-than-expected data may prompt the market to pre-emptively bet on a Fed rate cut. In addition to the US, the Bank of England will hold its interest rate meeting this week. For GBP/USD traders, the biggest risk event may come from the Bank of England's interest rate decision on Thursday, as the pound has already depreciated in tandem with the dollar earlier this week.
From a technical analysis perspective, the GBP/USD exchange rate has been trading within a range for most of the second half of this year. Recently, the exchange rate has continued to rise, breaking through several short-term technical resistance levels and moving averages. However, it has encountered key resistance near the 1.3472 (October 17 high) and 1.3500 (psychological level), and some selling pressure is expected at these levels before the macroeconomic events this week. Currently, the GBP/USD exchange rate is trading within an ascending triangle pattern, and downside risks are gradually accumulating. If the 1.3365 (10-day moving average) support level is effectively broken, the exchange rate may further decline, with subsequent support levels at 1.3300 (psychological level) and 1.3252 (50-day moving average). On the upside, the key levels for the exchange rate are 1.3472 (October 17 high) and 1.3500 (psychological level), with the next resistance level pointing to 1.3527 (October 1 high).
Consider going long on GBP/USD today around 1.3366; Stop loss: 1.3354; Target: 1.3410; 1.3420
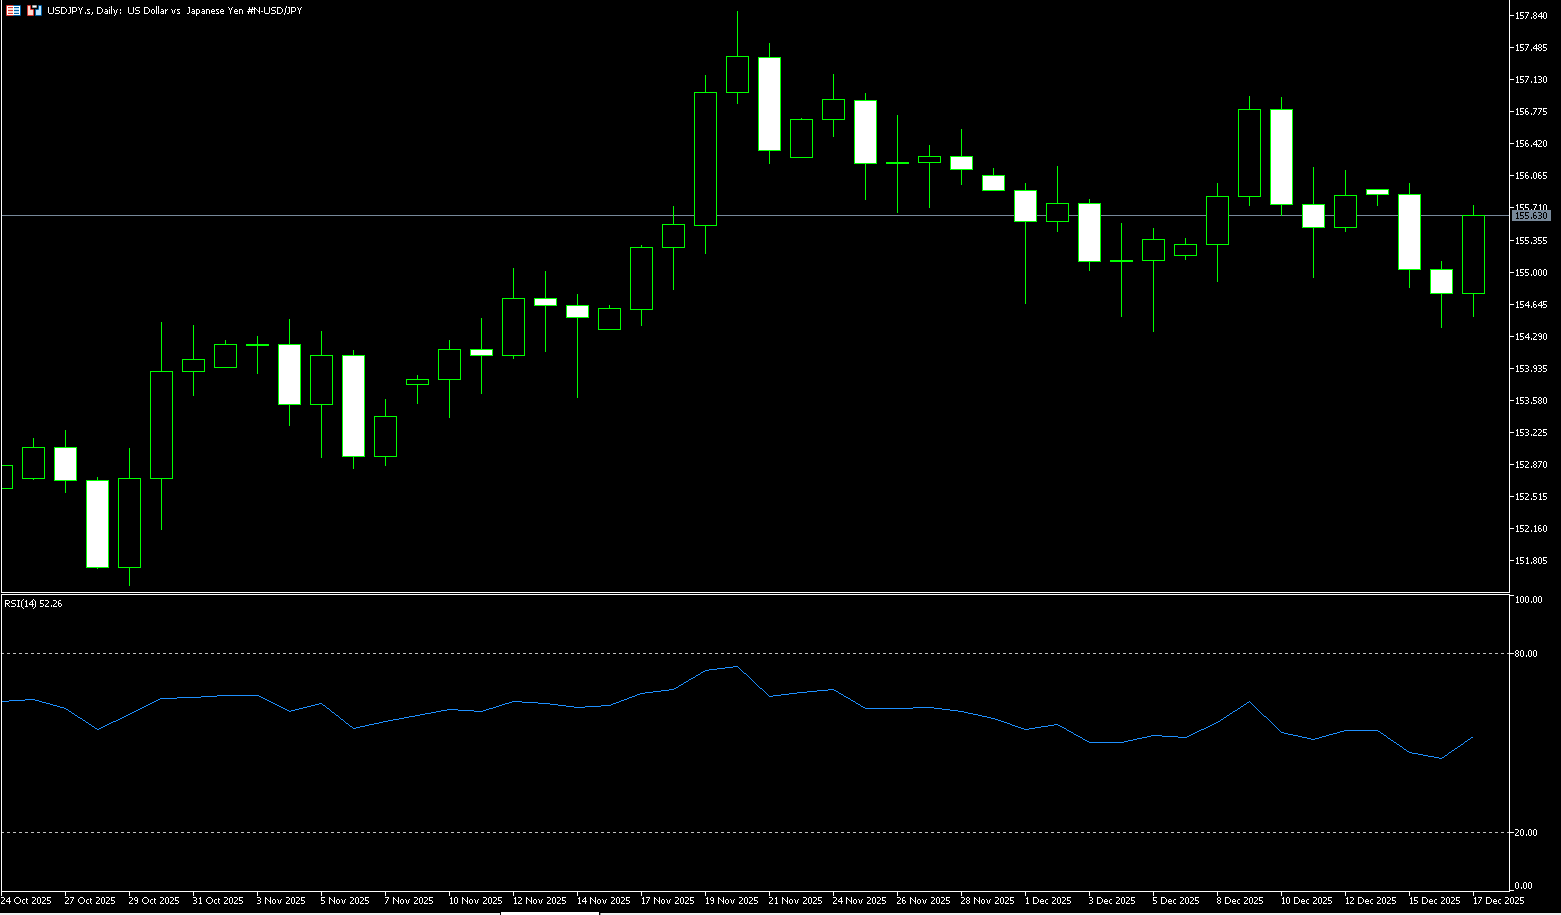
USD/JPY
The USD/JPY pair rose 0.55%, approaching 155.70 during Wednesday's American trading session. The pair strengthened as the dollar outperformed other currencies following the release of the US October and November non-farm payroll reports. The yen appreciated to around 154.60 yen per dollar on Wednesday, hovering near a one-month high, as strong economic data reinforced expectations of a Bank of Japan rate hike this week. Exports rose 6.1% in November, exceeding the 4.8% forecast and marking the strongest growth in nine months. Core machinery orders, a key leading indicator of capital expenditure over the next six to nine months, also rose 7%, defying the expected 2.3% decline. The Bank of Japan is expected to raise its policy rate by 25 basis points to 0.75% on Friday, and investors will be watching Governor Kazuo Ueda's comments after the meeting for guidance on the policy trajectory next year, with some speculating that rates could reach 1% in July. However, concerns about Japan's deteriorating fiscal situation, triggered by Prime Minister Sanae Takaichi's spending plans, limited further gains for the yen.
From a technical perspective, the USD/JPY pair is showing a clear weakening structure. The exchange rate has repeatedly encountered resistance near short-term moving averages, failing to effectively break above 156.96.00 (the high of December 9th) and the 20-day moving average area of 155.90, indicating significant selling pressure above. Subsequently, the price broke below the nearly one-month low of 154.30-154.40, releasing a bearish technical signal and giving short-term bears the upper hand. On the downside, the intraday low around 154.33-154.40 forms the first important support level; a test of this area could trigger short-term trading. If this support is breached, the psychological level of 154.00 will become the next key defense, and a break below this level could open up further downside potential to the 60-day simple moving average at 153.42. From a rebound perspective, the 155.40 area has become an initial resistance zone; this level previously served as support in the short-term consolidation range and now acts as resistance. If the price attempts to rebound but fails to regain a foothold in this area, the upside potential will be significantly limited. Only after breaking through the aforementioned resistance can the price further challenge the 20-day moving average at 155.90 and the 156.96.00 area (the high of December 9th).
Today, consider shorting the US dollar near 155.95; Stop loss: 156.15; Target: 155.00; 154.80
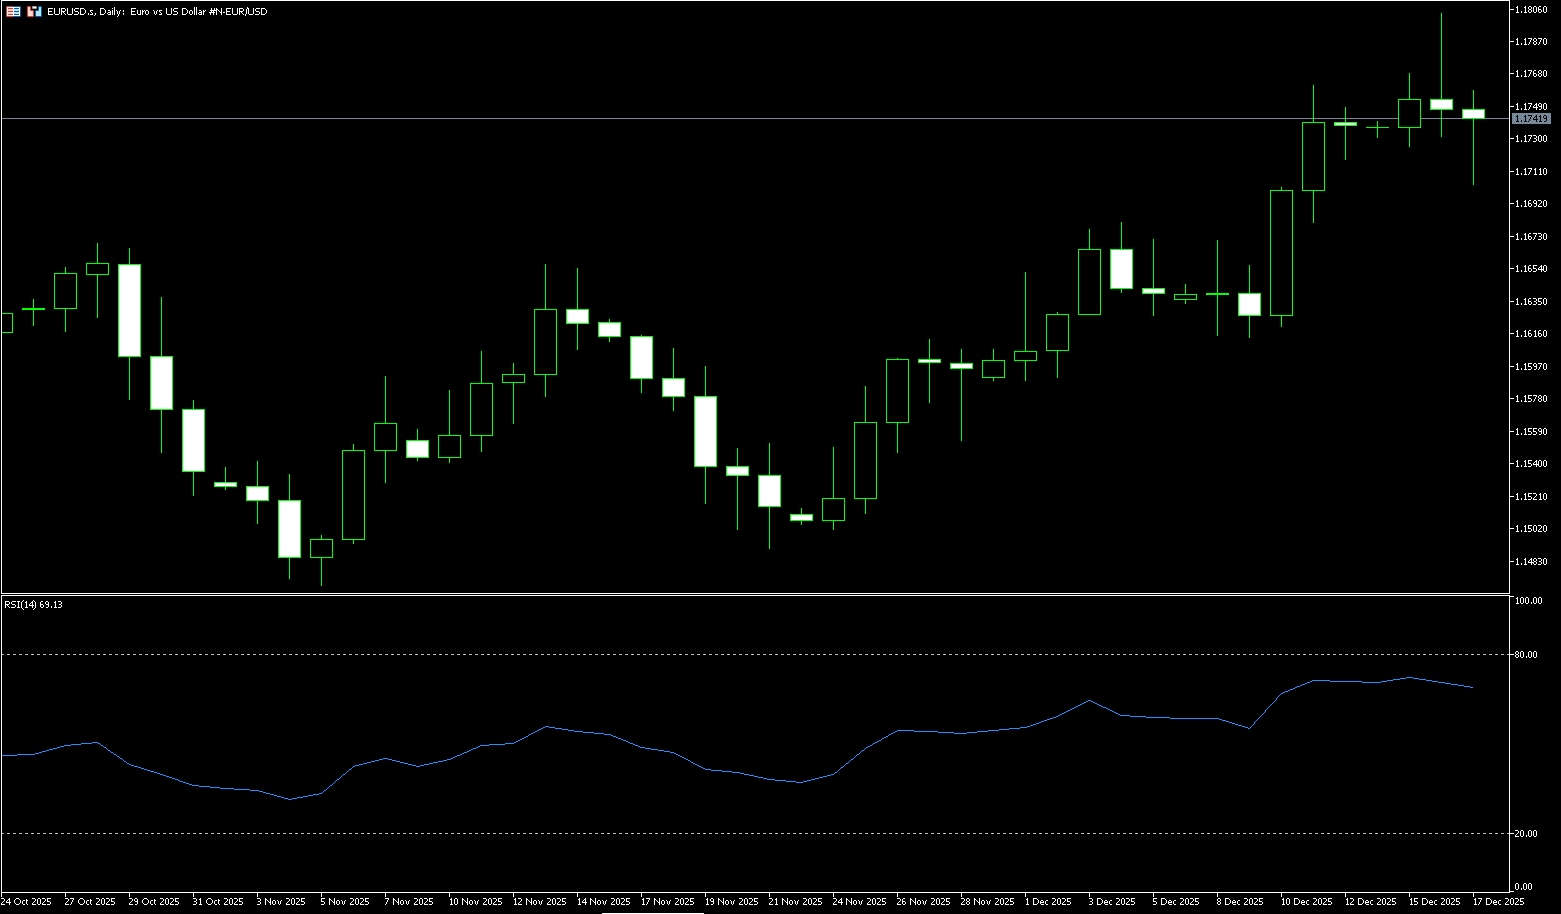
EUR/USD
The EUR/USD pair held steady around 1.1730 during Wednesday's European session, reaching a near three-month high of 1.1804. Meanwhile, the fundamental backdrop remains bullish for traders, suggesting the path of least resistance for the spot price remains upward. The dollar struggled to capitalize on the previous day's rebound from its lowest levels since early October amid dovish bets on the Federal Reserve, providing a tailwind for the EUR/USD pair. Furthermore, expectations of a dovish successor to Fed Chair Powell also limited the dollar's gains. On the other hand, the euro continues to receive increasing acceptance that the ECB has stopped cutting interest rates. However, traders appear reluctant to act, opting to await Thursday's key ECB meeting. The latest US consumer inflation data, to be released after the meeting, will play a crucial role in driving dollar demand and providing new momentum for the EUR/USD pair.
The EUR/USD pair has temporarily escaped its bearish crisis and has shifted from a downtrend to an uptrend, reaching a near three-month high of 1.1804 on Tuesday. Current support levels are at the 10-day moving average at 1.1697 and the psychological level of 1.1700. Resistance levels are currently at the psychological level of 1.1800 and Tuesday's high of 1.1804. The 20-day simple moving average has risen above the 50-day and 200-day simple moving averages, all three showing an upward trend. The price holding above these indicators keeps the near-term bias upward. The 14-day Relative Strength Index (RSI) is at 69.52, indicating a bullish but not overbought condition, with momentum slightly weakening from previous highs. On the upside, the upper limit of the ascending channel acts as the first resistance level at the psychological level of 1.1800, followed by the three-month high of 1.1804. On the downside, the 10-day moving average at 1.1697 and the psychological level of 1.1700 are key support areas. A close below these levels would weaken the trend and could bring it to the 20-day exponential moving average at 1.1640.
Consider going long on the Euro today around 1.1728; Stop loss: 1.1718; Target: 1.1780; 1.1770
Disclaimer: The information contained herein (1) is proprietary to BCR and/or its content providers; (2) may not be copied or distributed; (3) is not warranted to be accurate, complete or timely; and, (4) does not constitute advice or a recommendation by BCR or its content providers in respect of the investment in financial instruments. Neither BCR or its content providers are responsible for any damages or losses arising from any use of this information. Past performance is no guarantee of future results.
Lebih Liputan


Pendedahan Risiko:Instrumen derivatif diniagakan di luar bursa dengan margin, yang bermakna ia membawa tahap risiko yang tinggi dan terdapat kemungkinan anda boleh kehilangan seluruh pelaburan anda. Produk-produk ini tidak sesuai untuk semua pelabur. Pastikan anda memahami sepenuhnya risiko dan pertimbangkan dengan teliti keadaan kewangan dan pengalaman dagangan anda sebelum berdagang. Cari nasihat kewangan bebas jika perlu sebelum membuka akaun dengan BCR.
BCR Co Pty Ltd (No. Syarikat 1975046) ialah syarikat yang diperbadankan di bawah undang-undang British Virgin Islands, dengan pejabat berdaftar di Trident Chambers, Wickham’s Cay 1, Road Town, Tortola, British Virgin Islands, dan dilesenkan serta dikawal selia oleh Suruhanjaya Perkhidmatan Kewangan British Virgin Islands di bawah Lesen No. SIBA/L/19/1122.
Open Bridge Limited (No. Syarikat 16701394) ialah syarikat yang diperbadankan di bawah Akta Syarikat 2006 dan berdaftar di England dan Wales, dengan alamat berdaftar di Kemp House, 160 City Road, London, City Road, London, England, EC1V 2NX. Entiti ini bertindak semata-mata sebagai pemproses pembayaran dan tidak menyediakan sebarang perkhidmatan perdagangan atau pelaburan.

 English
 简体中文
简体中文
 繁體中文
繁體中文
 Bahasa
Melayu
Bahasa
Melayu
 Tiếng
Việt
Tiếng
Việt
 ไทย
ไทย
 日本語
日本語
 한국어
한국어
 ភាសាខ្មែរ
 español